NIFTY — Expert take for Monday, 29 September 2025
Summary / Lead
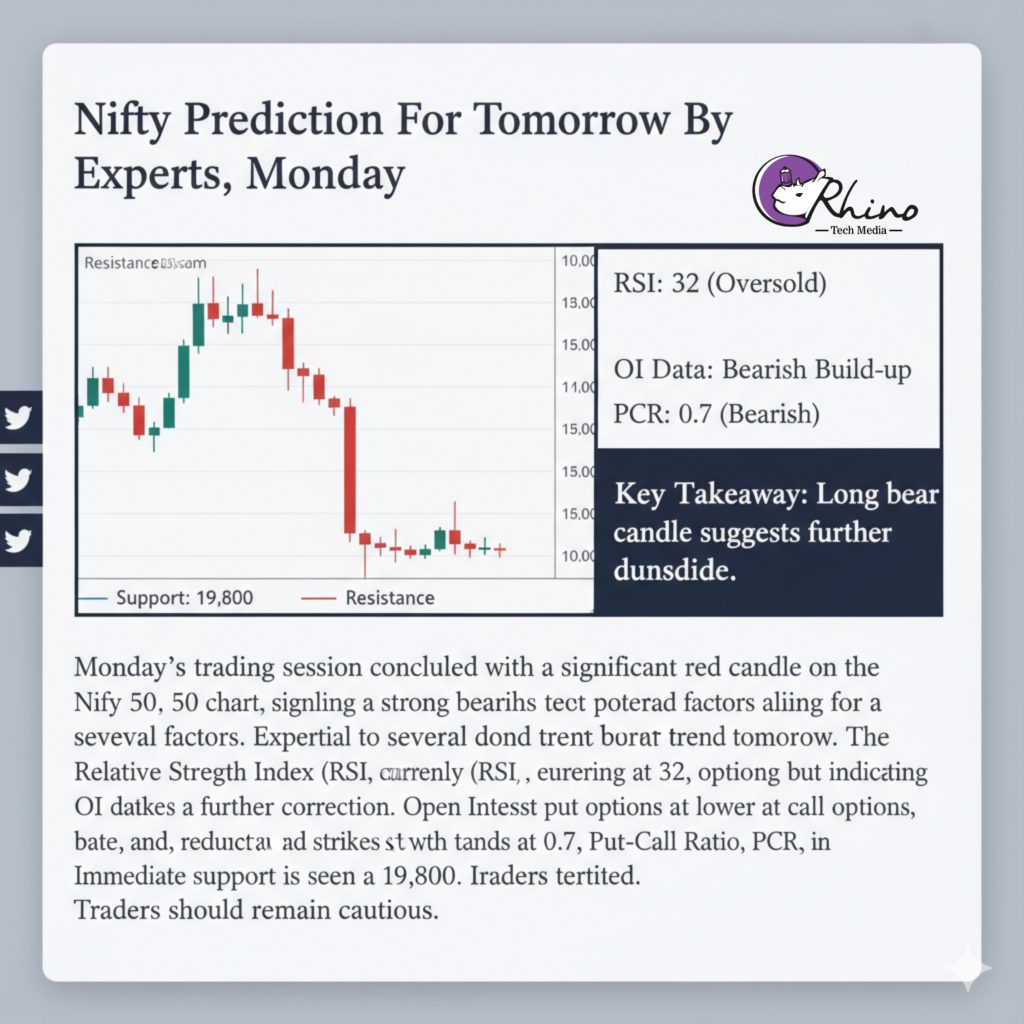
On the daily chart Nifty closed the week with a long bearish candle, signalling clear downside conviction in the last session. That technical picture, when combined with option-market flows and momentum readings, keeps the near-term odds tilted toward further weakness unless buyers re-assert themselves immediately on Monday.
Chart structure — the long bear candle and what it means
A long red (bear) daily candle means sellers dominated the session from open to close and usually marks continuation of a short-term down leg or a capitulation day depending on context. Experts flag such a candle as a caution: if the next session fails to reclaim the candle’s midpoint or the nearby resistance level, the path of least resistance stays lower. ET-Now’s technical note for the index explicitly calls out this long bear candle and the immediate break-down.
Support and resistance (practical levels to watch)
- Immediate support: 24,520 — first intraday stop for bounces.
- Next support / structural level: 24,400 — breach of this level would increase the probability of a deeper pullback.
- Immediate resistance / level to flip bullish: 24,800 — reclaiming and holding above this would materially reduce near-term bearish odds.
(These are the expert levels published in the same technical note and widely used by desk analysts for intraday / overnight planning.)
Momentum: RSI and other indicators
- RSI (14, daily): ~20 (oversold zone). A sub-30 / ~20 reading shows the index is in oversold territory on momentum — technically that opens the door for short covering rallies but does not by itself guarantee a sustained reversal. Momentum oscillators (RSI/Stochastic) currently signal oversold conditions while trend indicators such as MACD/ADX are still on the bearish side, i.e., the trend remains negative even as momentum is stretched.
Open Interest (OI) — what the options market is doing
- Exchange option-chain/OI screens show concentration of large OI around the 24,700–24,800 strikes for the near expiry, and option-platform OI trackers are flagging notable OI levels in both call and put strikes at that band. That concentration means the 24,700–24,800 area is a battle zone — market participants have significant positions there (both hedges and directional bets), so moves through that band can trigger gamma/hedging flows. In short: watch how OI reacts around the 24,700–24,800 cluster on Monday.
Put-Call Ratio (PCR) — current read and interpretation
- The live PCR read shown on market trackers is around 0.53–0.54 (puts / calls by OI). A PCR below 1 typically indicates more call OI than put OI — on its face that is not an outright bearish reading (many times a low PCR can be read as bullish bias), but PCR must be read with price action: here we have a low PCR together with a bearish price candle and elevated put OI at certain strikes — which suggests conflicting forces (call sellers or short-covering vs. genuine put buying in select strikes). Use PCR as a confirmatory tool rather than a sole signal.
Putting the pieces together — expert short-term view
- Bias: Near-term bias remains bearish until Nifty convincingly reclaims 24,800 and closes above the body (or midpoint) of the long red candle. The long bear candle and negative breadth/flow headlines from last week favour continuation or at least further consolidation before any reliable rally.
- Counter-scenario: Because RSI is deeply oversold (~20), expect sharp short-covering bounces (technical relief rallies). If such a bounce is sustained above 24,800 with improving breadth and falling volumes on down days, the market can shift back to neutral/bullish.
- Option-flow watch: Watch whether OI at key strikes (24,700–24,800) increases (new positions) or decays (roll/close). New put OI build would deepen downside risk; large call-OI build combined with price falls might reflect call writing (bearish). PCR near 0.53 suggests heavier call OI overall — interpret in context.
Actionable checklist for traders (practical rules for Monday)
- For shorts: consider keeping stops above 24,800; target first 24,520 then 24,400; trim into sharp rallies because oversold bounces can be violent.
- For longs: prefer to wait for a clean reclaim and close above 24,800 or intraday confirmation (higher lows and RSI recovering above ~35–40). Avoid “catching the falling knife.”
- Option traders: monitor intraday PCR changes and strike-wise OI; be cautious opening naked directional positions until OI around the 24,700–24,800 cluster clarifies.
- Risk management: use defined risk sizing — if volatility spikes, widen stops or reduce size — the next 1–2 sessions may have higher gamma and stop hunts around concentrated strikes.
Final note (market context & caveats)
Macro/flow factors (FIIs/DII flows, global cues) have been pressuring Indian markets lately, so technicals aren’t the only driver — news flow and foreign flows can amplify moves quickly. Technical indicators such as RSI and candle patterns are useful for timing but should be combined with OI/PCR context and strict risk controls.

